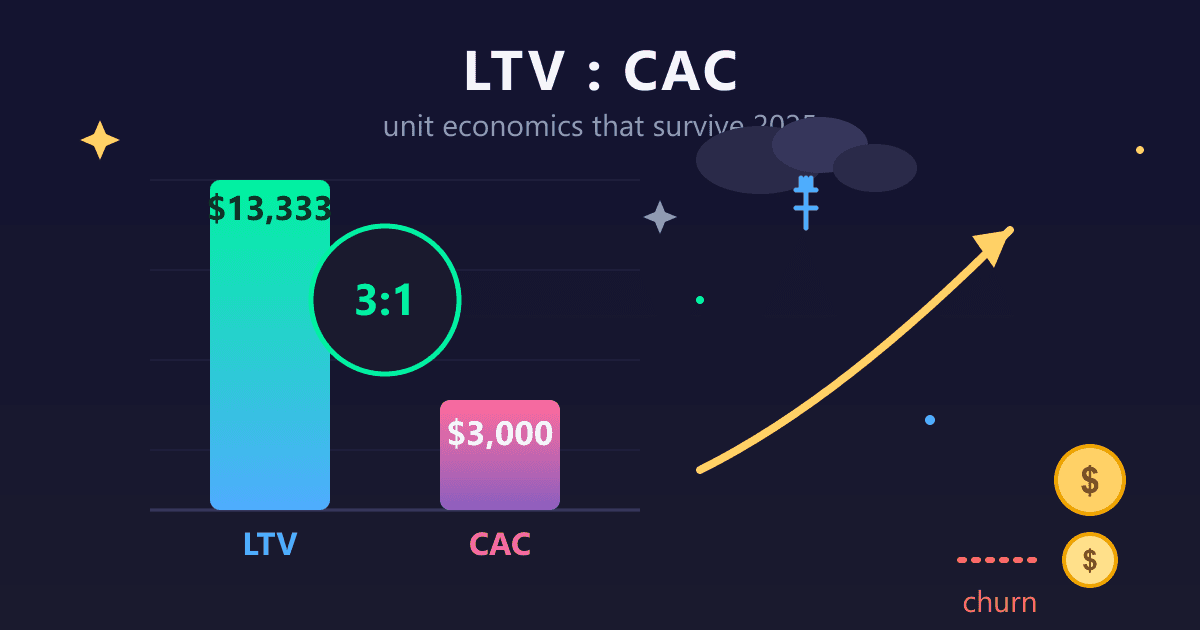
The LTV:CAC ratio measures how much value a customer generates compared to what it costs to acquire them. A healthy SaaS business targets a 3:1 ratio minimum, meaning each $1 spent on acquisition generates $3 in customer lifetime value.
For example, a company with $500 monthly ARPA, 80% gross margin, and 3% monthly churn has an LTV of $13,333. If customer acquisition costs $3,000, the LTV:CAC ratio is 4.4:1—strong unit economics.
Try SaaS LTV/CAC Calculator — free, no sign-up, and it runs entirely in your browser.
With 73% of SaaS companies experiencing doubled acquisition costs in 2026 and 966 U.S. startups shutting down (many due to unsustainable unit economics), understanding your LTV:CAC ratio has shifted from nice-to-have to existential necessity.
This guide explains how to calculate LTV, CAC, and the ratio between them, what the numbers mean for your business, and current 2025 benchmarks.
→ Calculate your unit economics now with our free SaaS LTV/CAC Calculator.
What Is Customer Lifetime Value (LTV)?
Customer Lifetime Value (LTV) represents the total revenue a business can expect from a single customer account throughout their entire relationship. It accounts for how long customers stay, how much they pay, and how that payment changes over time.
LTV answers a fundamental question: how much is a customer actually worth? Without this number, you are flying blind on marketing spend, pricing decisions, and growth strategy.
How Do You Calculate LTV?
The basic LTV formula:
LTV = (ARPA x Gross Margin %) / Churn Rate
| Variable | Definition | Example |
|---|---|---|
| ARPA | Average Revenue Per Account (monthly) | $500 |
| Gross Margin | Revenue minus cost to serve | 80% |
| Churn Rate | Monthly customer loss rate | 3% |
Example calculation: ($500 x 0.80) / 0.03 = $13,333 LTV
Each customer acquired is worth approximately $13,333 in gross profit over their lifetime with the company.
Why Gross Margin Matters in LTV
Some LTV calculations skip the gross margin adjustment, which overstates customer value. If it costs $200 per month in hosting, support, and infrastructure to serve a customer paying $500, only $300 actually contributes to covering acquisition costs and generating profit.
SaaS companies typically achieve gross margins between 70-85%. Lower margins often indicate infrastructure inefficiency, over-investment in customer success relative to pricing, or unsustainable discounting. Higher margins suggest healthy unit economics at the operational level.
What Is Customer Acquisition Cost (CAC)?
Customer Acquisition Cost (CAC) measures the total expense required to acquire a new customer—including marketing spend, sales compensation, tools, and overhead.
The CAC formula:
CAC = Total Sales and Marketing Costs / Number of New Customers Acquired
Example: A company spending $150,000 monthly on marketing and sales that acquires 50 new customers has a CAC of $3,000.
What Costs Should Be Included in CAC?
Include all of these in your CAC calculation:
- Advertising and paid media spend
- Content marketing costs (including contractors/agencies)
- Marketing technology stack (CRM, marketing automation, analytics)
- Sales team salaries and commissions
- Sales enablement tools
- Event and conference expenses
- Overhead allocation for marketing and sales departments
- Founder time (often excluded but should be included)
Important: If a founder spends 50% of their time on sales at $200/hour equivalent, that is real CAC even if no paycheck reflects it.
Blended vs. Paid CAC: Blended CAC (all customers) provides the more honest picture. Organic channels still require investment in content, SEO, and product quality.
What Is a Good LTV:CAC Ratio?
The LTV:CAC ratio expresses how much value you create for every dollar spent on customer acquisition. A 3:1 ratio is the industry standard minimum; 4:1 or higher is preferred by most investors in 2026.
LTV:CAC Ratio = Customer Lifetime Value / Customer Acquisition Cost
Example: With LTV of $13,333 and CAC of $3,000, the ratio is 4.4:1—strong unit economics.
2025 LTV:CAC Ratio Benchmarks
| Ratio | Interpretation | Investor View |
|---|---|---|
| < 1:1 | Losing money on every customer | Not fundable |
| 1:1 to 3:1 | Marginal economics | Requires clear improvement path |
| 3:1 | Industry standard "golden ratio" | Minimum for fundability |
| 4:1 | Strong unit economics | Preferred by B2B SaaS investors |
| > 5:1 | Excellent but may indicate underinvestment | Consider scaling acquisition |
Key insight: The 3:1 ratio has become the de facto minimum threshold for SaaS fundability. Many investors now prefer 4:1+ given the challenging environment for capital efficiency.
LTV:CAC Benchmarks by Industry Vertical
| Industry | Typical LTV:CAC Ratio | Why |
|---|---|---|
| Ad Tech | 7:1 | High contract values, sticky integrations |
| Cybersecurity | 4:1 to 5:1 | Strong retention, compliance requirements |
| Fintech | 4:1 to 5:1 | High switching costs, expansion revenue |
| B2B SaaS (general) | 4:1 | Industry average |
| B2C SaaS | 2.5:1 | Higher churn, lower ARPA |
These differences reflect structural factors: contract sizes, switching costs, competitive intensity, and buyer behavior patterns.
What Is CAC Payback Period?
CAC payback period measures how many months it takes to recover customer acquisition costs from that customer's revenue. It tells you if your unit economics work from a cash flow perspective.
CAC Payback Period = CAC / (ARPA x Gross Margin %)
Example: $3,000 CAC / ($500 x 0.80) = 7.5 months to recover acquisition costs.
2025 CAC Payback Period Benchmarks
| Payback Period | Rating | Implication |
|---|---|---|
| < 6 months | Excellent | Rapid reinvestment possible |
| 6-12 months | Good | Healthy B2B SaaS target |
| 12-18 months | Acceptable | 2024 median due to rising costs |
| > 18 months | Concerning | Significant cash flow pressure |
Why payback period matters: A company with 6-month payback can reinvest recovered CAC twice per year. A company with 18-month payback ties up capital nearly three times as long—requiring much more funding to achieve the same growth.
Know your numbers. Use our SaaS LTV/CAC Calculator to instantly calculate your LTV, CAC, ratio, and payback period with current benchmarks.
Why Unit Economics Matter More Than Ever in 2026
- Rising acquisition costs. Google ads increased 40% year over year in 2026. Sales cycles lengthened 30-40% as buying committees expanded and procurement processes tightened. Companies that could acquire customers profitably at 2021 CAC levels often find current costs unsustainable.
- Valuation compression. SaaS multiples averaged roughly 7x revenue in 2026, down from 15-20x during the 2021 peak. This compression means companies need to show a profitability path, not just growth. Strong unit economics become a valuation floor.
- Investor scrutiny. Global VC investment in enterprise software grew 27% to $155 billion in 2026, but with intense focus on profitability metrics. The Rule of 55 is emerging as a higher bar than the traditional Rule of 40 (growth rate plus profit margin).
- Startup mortality. The 966 U.S. startups that shut down in 2026 represented a 25.6% increase from 2023. Many failures traced to unsustainable unit economics that worked only with continued funding. When funding dried up, so did the companies.
How Do You Improve Your LTV:CAC Ratio?
The ratio has only two levers: increase LTV or decrease CAC. Most successful improvements tackle both simultaneously.
How to Increase Customer Lifetime Value
| Strategy | Impact | Example |
|---|---|---|
| Reduce churn | Cutting churn from 5% to 3% increases LTV by 67% | Better onboarding, proactive success outreach |
| Drive expansion | Net retention above 100% grows existing revenue | Usage-based pricing, premium tiers |
| Optimize pricing | 10-15% price increase flows directly to LTV | Value-based pricing analysis |
| Improve margins | Better unit economics at operational level | Infrastructure efficiency, automation |
How to Reduce Customer Acquisition Cost
| Strategy | Impact | Implementation |
|---|---|---|
| Invest in organic | Lower marginal costs, compounds over time | Content marketing, SEO, community |
| Improve conversions | More customers from same spend | Landing page optimization, sales process |
| Target better leads | Higher conversion, longer retention | Narrow to ideal customer profile |
| Leverage referrals | Fastest conversions, longest retention | Formalized referral programs |
Key insight: Reducing churn often has the highest leverage. A 2% improvement in monthly churn can increase LTV by 40-70%.
What Are Common LTV:CAC Calculation Mistakes?
Five mistakes that lead to inaccurate unit economics:
-
Ignoring gross margin. Calculating LTV without gross margin inflates customer value by 20-40%. If your gross margin is 75%, you are overstating LTV by 25% if you skip this adjustment.
-
Mixing timeframes. Using monthly ARPA but annual churn rate produces meaningless results. Ensure all variables use consistent time periods—monthly throughout or annual throughout.
-
Excluding costs from CAC. Omitting founder time, overhead, or tooling understates true acquisition costs by 15-30%. The customer does not care how you categorize expenses internally.
-
Not segmenting by customer type. Blended numbers hide that some segments are profitable while others destroy value. Enterprise ($50K ACV, 2% annual churn) and SMB ($200 ACV, 8% monthly churn) have vastly different unit economics.
-
Using outdated numbers. CAC and churn shift over time. Calculations based on 2021 figures may have little relevance in 2026. Refresh unit economics quarterly at minimum.
Frequently Asked Questions
What is a good LTV to CAC ratio for SaaS? The industry standard minimum is 3:1, meaning each dollar spent on customer acquisition generates three dollars of lifetime value. Many B2B SaaS companies target 4:1 or higher in 2026. Ratios below 3:1 suggest unsustainable unit economics; ratios above 5:1 may indicate underinvestment in growth.
Should I include founder time in CAC? Yes, for accurate unit economics. If founders spend significant time on sales and marketing, that time has real opportunity cost. A founder spending 50% of their time on sales at $200/hour equivalent adds $4,000+ monthly to CAC. Excluding it makes CAC appear lower than reality.
How do I calculate LTV with usage-based pricing? For usage-based models, calculate average revenue per account over time rather than fixed subscription amounts. Track how customer usage patterns evolve and use cohort analysis to understand typical revenue curves. LTV becomes the area under the revenue curve until churn.
What is more important: improving LTV or reducing CAC? It depends on your bottleneck. If churn is high (>5% monthly), LTV improvements have more leverage—cutting churn from 5% to 3% increases LTV by 67%. If acquisition costs are spiraling, CAC reduction matters more. Generally, reducing churn has compounding effects that make it valuable to prioritize early.
How often should I recalculate unit economics? Monthly monitoring with quarterly deep analysis works for most companies. Markets shift, acquisition channels mature, and customer behavior changes. Board decks should include updated unit economics each quarter at minimum.
What if my LTV:CAC ratio is below 1:1? This means you are losing money on every customer acquired. Immediate actions: pause or reduce paid acquisition, focus on retention for existing customers, increase pricing if possible, and reassess product-market fit. Some startups operate this way briefly during early stages, but it is not sustainable beyond seed.
How do enterprise and SMB customers differ in unit economics? Enterprise customers typically have higher LTV (larger contracts, longer retention, more expansion) but also higher CAC (longer sales cycles, more touchpoints). SMB customers have lower LTV but also lower CAC. The ratio often ends up similar, but absolute numbers and cash flow implications differ significantly.
What is the Rule of 40 and how does it relate to LTV:CAC? The Rule of 40 states that growth rate plus profit margin should exceed 40%. Strong LTV:CAC ratios contribute to profitability (the margin component), while they also enable efficient growth (the growth component). Companies with healthy unit economics can achieve the Rule of 40 more easily.
Calculate Your SaaS Unit Economics
Unit economics determine whether your business model actually works. Strong LTV:CAC ratios attract investors, enable efficient growth, and provide the foundation for building a durable company. Weak ratios eventually catch up with even the fastest-growing startups.
The companies that thrive in the current environment know their numbers precisely. They understand which customer segments are profitable, which acquisition channels deliver real returns, and where to focus improvement efforts.
Use our free SaaS LTV/CAC Calculator to calculate your customer lifetime value, acquisition cost, ratio, and payback period. Enter your metrics to see where you stand against current benchmarks and identify your highest-leverage improvement opportunities.
Updated October 2026: Discipline Over Vibes
Another year of funding-market reality made this guide's premise more true, not less: when capital is expensive, unit economics stop being a board-deck decoration and become the survival metric. The core teachings here — the 3:1 health band as a rule of thumb rather than a law, CAC payback period as the timeline check, gross-margin-honest LTV — are exactly the numbers investors and operators still argue about in October 2026.
Two refresh points worth underlining from the body of the guide:
- Recompute quarterly, not annually. The guide's warning about stale CAC (channels decay quietly) is the most common self-deception we see in SaaS financials.
- Segment before you average. A blended 3:1 can hide a 6:1 enterprise segment propping up a 0.8:1 self-serve segment. The guide's mistakes section covers this; it deserves bold type.
Run your own numbers with the free LTV:CAC calculator — it implements the exact formulas this guide teaches.