Agentic coding tools are the first developer software that bills like a utility: every file read, every retry, every "one more follow-up question" costs tokens, and the meter runs quietly while you think. If you run Claude Code against an API key, you eventually get an invoice and a vague sense of dread. If you are on a subscription, you get no meter at all. Either way, the detailed receipts already exist — Claude Code writes them to your own disk as it works.
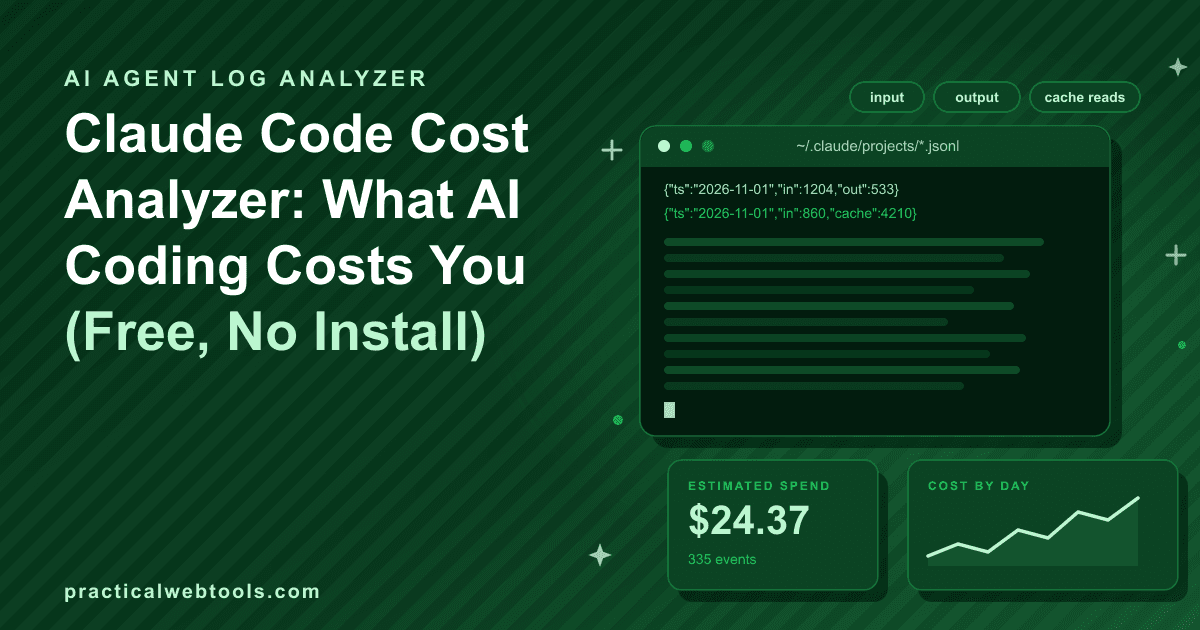
The AI Agent Log Cost Analyzer turns those receipts into numbers. Drag and drop your ~/.claude JSONL session logs, or an API usage export, and it totals tokens and estimated cost, charts the model mix and session lengths, applies an editable price table so the estimates reflect your actual rates, and exports the results as CSV or JSON. It is 100 percent local, in-browser. In testing on a sample log set: 335 events, $24.37 estimated cost, charts rendering — about five seconds from drop to insight.
Try AI Agent Log Cost Analyzer — free, no sign-up.
This post covers where the logs live, which fields matter, what the numbers reveal about how you actually work, and how the browser approach compares to ccusage and the paid dashboards that appeared through 2026.
Where Claude Code keeps its receipts
Session logs live under ~/.claude/projects/ as JSONL files — one file per session, one JSON object per line. Each event records the things that matter for billing: which model ran, the session it belongs to, tokens in and out, and cache reads. There is nothing exotic in the format; it is a plain text file you can open, grep, copy, and back up like any other.
The fields worth knowing by name:
| Field | Why it matters |
|---|---|
| Timestamp | Orders events into days and sessions — the basis of any "when do I spend" view |
| Session id | Groups events into working sessions, the unit session-length analysis runs on |
| Model | Separates spend by model; usually the single most actionable split |
| Input tokens | Billed on the way in; grows with the context you carry |
| Output tokens | Billed on the way out; grows with verbosity |
| Cache reads | Cached context is billed at a different rate; a big lever on real cost |
The files accumulate faster than most people guess — a few weeks of daily use produced the 335-event sample above. And because the format is plain JSONL, the same parsing works on API usage exports: any file with the same event shape loads the same way, which matters if you juggle more than one agent or provider.
What the spend actually looks like
Benchmarks floating around late 2026 put average API-based Claude Code spend at roughly $4–6 per developer-day, with heavy users reporting around $20 per hour in peak sessions. Daily numbers sound small until you annualize them: $5 a day is roughly $1,200 per developer per year, before the months where a gnarly refactor quietly doubles it.
Two honest caveats about any estimate, including the $24.37 one. First, token totals are read straight from the logs — those are facts — but cost is always computed by applying per-token rates to them. The analyzer ships an editable price table for exactly this reason: paste the rates from your plan or provider, and the same logs re-price instantly. Second, your number depends on your mix. An agent-heavy workflow with long sessions and a heavyweight default model lands nowhere near a light question-and-answer habit, which is precisely why the aggregate charts matter more than the headline total.
If you are weighing API spend against running models yourself, two adjacent reads cover that decision with real numbers: the local LLM versus API cost comparison for small teams and the six months of API costs retrospective.
Why subscription users still want this
On a subscription there is no invoice line per request, which is pleasant until you slam into rate limits and cannot tell what ate them. The logs still record every token — the metering exists, it is just not shown to you.
Drop a week of session files into the analyzer and the blind spot disappears: which projects, which models, and which working patterns consume your quota. That is the difference between "the limit feels tight lately" and "one project's long agent sessions dominate the week" — the first is a feeling, the second is a sentence you can act on, whether the action is restructuring how you work or reconsidering which tier you are on.
What the charts reveal
Three findings come out of the analyzer's charts, and each maps to a cost-control habit.
Model mix. The model-mix chart shows what share of your tokens went to which model. The common pattern it exposes: a heavyweight model doing work a lighter one would have finished. Routing routine, mechanical edits away from the flagship model is usually the single biggest lever the chart reveals — not because lighter models are free, but because the mix is the thing you control without changing how you work.
Session length. Session-length charts show the shape of your working sessions, and long sessions are expensive in a specific way: every turn re-sends the accumulated conversation as input tokens, so the fiftieth message of a session costs more than the first, whatever the task. Seeing session length plotted against cost makes the case for starting fresh sessions when context goes stale — stale context is not just lower quality, it gets re-billed on every single turn.
Cache reads. A high share of cache reads means the setup is re-using carried context at the cheaper cached rate instead of re-paying full input price for it. A low share on repetitive workflows points at restructuring: shorter, more focused sessions, and less dead context dragged from task to task.
None of these are exotic optimizations. They are the working habits the logs make visible — which is the actual product of a Claude Code JSONL analyzer, more than any single dollar figure.
Browser tool, ccusage, or a paid dashboard
ccusage, the open-source CLI, parses the same local logs from the terminal. It is solid and scriptable, and if you live in a shell anyway it is a reasonable default. Through 2026, five paid dashboards launched on top of the same underlying files — Opaline, Inferock, LangWatch CC Tracker, AUDR, and Navigara — wrapping agent log analysis into hosted team reporting.
| ccusage (CLI) | Paid dashboards (2026) | Agent Log Cost Analyzer | |
|---|---|---|---|
| Runs where | Your terminal | Their service | Your browser tab |
| Setup | CLI install | Sign up / account | None — open the page |
| Price | Open source | Paid | Free |
| Rate control | Whatever the tool applies | Varies by product | Editable price table — paste your rates |
| Export | Terminal-oriented | Dashboard-dependent | CSV and JSON |
| Log scope | Local ~/.claude logs | Local logs, their rendering | Any JSONL export, processed locally |
The browser analyzer's angle is the intersection none of the others occupy: no install, no account, rates you control, and it accepts any JSONL export rather than one specific path. For a one-off "what am I actually spending" session, drag-and-drop beats installing a CLI; for a standing cron job that reports every morning, the CLI wins; for team rollups, the paid tools earn their keep. If you are still choosing the coding agent itself, the Cursor versus Claude Code workflow comparison is the adjacent read.
The five-minute audit
- Locate the logs. Look under ~/.claude/projects/*.jsonl, sort by modified date, and grab the recent ones.
- Drop them in. Drag the files onto the agent cost analyzer page — no install, no account.
- Read the totals. Token counts and estimated cost, overall and split by model.
- Fix the rates. Open the price table, paste the rates from your plan or provider, and watch the totals re-price.
- Read the charts. Model mix first, session lengths second, cache-read share third — in that order of typical leverage.
- Export. CSV for the spreadsheet, JSON for the script you will inevitably write.
The analyzer is fully local: no upload, no sign-up — nothing you type or drop leaves your device. That is the right default for log files, which name your projects, your file paths, and sometimes your half-finished ideas.
Frequently Asked Questions
Where exactly are my Claude Code logs?
Under ~/.claude/projects/ — JSONL files, one per session, one JSON event per line. Each event carries the model, session id, tokens in and out, and cache reads. They are plain text; nothing needs to be exported or converted first.
Do my logs leave my machine?
No. The analyzer runs 100 percent in the browser: no upload, no sign-up — nothing you type or drop leaves your device. The CSV and JSON exports are generated locally too.
I am on a subscription, not an API key. Is this useful?
Arguably more so. A subscription surfaces no per-request meter, but the logs still record every token. The analyzer shows which workloads actually consume your quota — the information a flat plan limit does not give you.
How accurate are the cost estimates?
As accurate as the rates behind them. Token totals come straight from the logs; cost is computed by applying the editable price table. Paste your actual plan's or provider's rates, and the estimate is exactly as good as your log data.
How do I actually cut what I spend?
Three levers, in the order the charts usually rank them: route routine work to cheaper models (watch the model-mix chart), start fresh sessions instead of dragging stale context along (watch session lengths), and check your cache-read share on repetitive workflows.
Is this a ccusage alternative?
For interactive analysis, yes — same local logs, no terminal install, plus an editable rate table and CSV/JSON export. For scripted, recurring reports that live in the terminal, ccusage remains the natural fit.