CAGR Explained: A Guide to Calculating Annual Growth Rate
Ever looked at an investment's performance and felt lost in a sea of fluctuating numbers? One year it's up 20%, the next it's down 10%, and the year after it's up 15%. How do you make sense of this roller-coaster ride and figure out what the actual, steady growth was? Simple averages can be misleading, and total returns don't tell the whole story over time.
This is where the Compound Annual Growth Rate, or CAGR, comes in. It's a financial metric that cuts through the noise of market volatility to give you a single, smooth number representing the average annual growth of an investment over a specific period. It’s the key to making apples-to-apples comparisons and gaining a truer understanding of performance.
In this comprehensive guide, we'll dive deep into CAGR. We'll break down what it is, why it's so crucial for investors and analysts, and walk you through how to calculate it—both manually and with an easy-to-use calculator. By the end, you'll be able to wield CAGR with confidence to make more informed financial decisions.
What Exactly is Compound Annual Growth Rate (CAGR)?
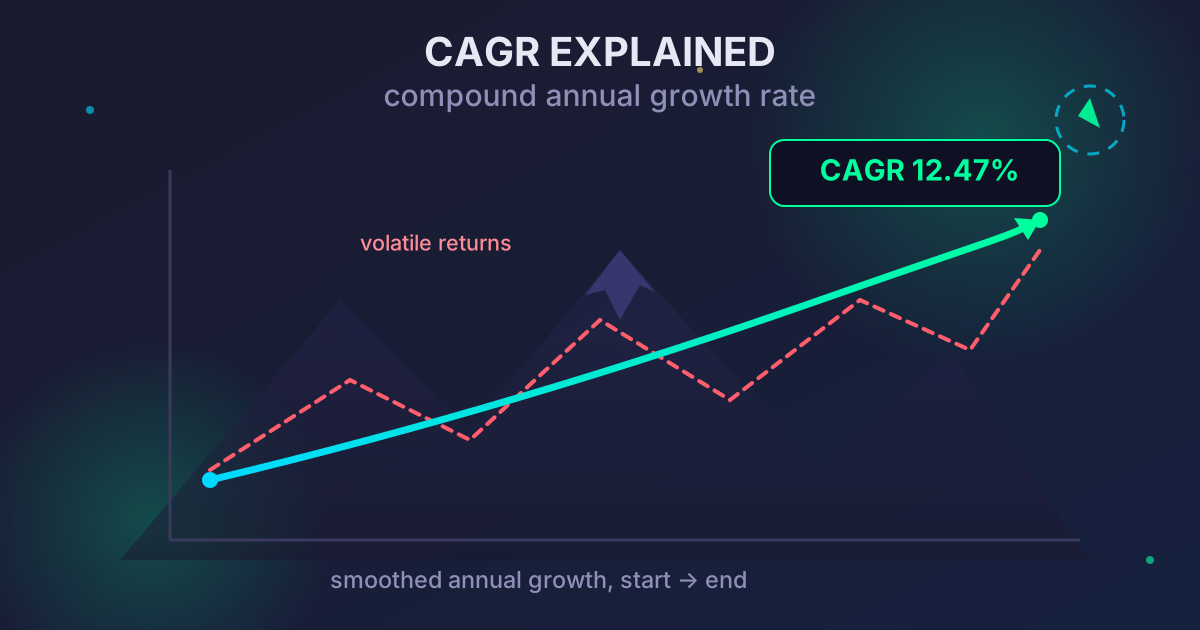
Compound Annual Growth Rate (CAGR) is the mean annual growth rate of an investment over a specified period of time longer than one year. Think of it as a financial smoothing tool. It tells you what an investment's annual growth rate would have been if it had grown at a steady, consistent rate over the entire period.
Imagine driving up a mountain. The road has steep inclines, flat sections, and even some downhill slopes. The journey is volatile and uneven. CAGR is like drawing a straight line from the base of the mountain to the peak. That straight line represents a constant, steady climb that gets you to the same destination in the same amount of time. It doesn't show the bumps along the way, but it gives you a clear and simple measure of your overall progress.
In financial terms, CAGR irons out the volatility of returns, providing a single, representative number that is far more useful for comparison than simple or average returns.
Why CAGR is an Essential Tool for Analysis
Understanding CAGR isn't just for Wall Street professionals. It's an incredibly practical tool for anyone interested in personal finance, business, or market analysis. Here’s why it matters:
- Standardized Performance Comparison: Its primary benefit is providing a standardized way to compare the performance of different assets. Should you have invested in Stock A or Mutual Fund B over the last five years? By calculating the CAGR for both, you can directly compare their annualized growth, even if their journeys were very different.
- A More Realistic Picture of Growth: Yearly returns can be deceptive. A fund might have one spectacular year that inflates its average return. CAGR, by its nature, accounts for the effects of compounding and provides a more realistic, smoothed-out perspective on long-term performance.
- Goal Setting and Forecasting: While past performance is no guarantee of future results, CAGR can be a useful tool for projecting potential future values. If a company's revenue has grown at a CAGR of 15% over the last decade, you can use that as a baseline for future growth models.
- Beyond Stocks and Bonds: CAGR isn't limited to investments. Businesses use it to analyze the growth of revenue, profit, users, or any other key metric over time. It helps them understand their long-term trajectory and set realistic targets.
The CAGR Formula Unpacked
While the concept is powerful, the math behind it is surprisingly straightforward. The formula for CAGR is as follows:
CAGR = [ (Ending Value / Beginning Value)^(1 / n) ] - 1
Let's break down each component:
- Ending Value (EV): The value of the investment at the end of the period.
- Beginning Value (BV): The value of the investment at the start of the period.
- n: The number of years (or periods) in between.
Essentially, the formula calculates the nth root of the total growth factor, which gives you the constant annual growth factor. Subtracting 1 converts that factor into a percentage rate.
How to Calculate CAGR: A Step-by-Step Example
Let's put the formula into practice. Imagine you invested $10,000 in a mutual fund. After 5 years, your investment is now worth $18,000.
Here’s how to calculate the CAGR step-by-step:
-
Identify Your Variables:
- Beginning Value (BV) = $10,000
- Ending Value (EV) = $18,000
- Number of Years (n) = 5
-
Divide the Ending Value by the Beginning Value:
- $18,000 / $10,000 = 1.8
-
Raise the Result to the Power of (1/n):
- n = 5, so 1/n = 1/5 = 0.2
- 1.8 ^ 0.2 ≈ 1.1247
-
Subtract 1 from the Result:
- 1.1247 - 1 = 0.1247
-
Convert to a Percentage:
- 0.1247 * 100 = 12.47%
So, the Compound Annual Growth Rate (CAGR) for your investment is 12.47%. This means that your investment grew at an average, smoothed-out rate of 12.47% per year for five years.
Practical Applications of CAGR
CAGR is a versatile metric used across various fields. Here are some common real-world scenarios where it proves invaluable.
Evaluating Investment Portfolios
This is the most common use case. You can calculate the CAGR for your entire portfolio or for individual assets within it (stocks, bonds, real estate) to see what's driving your growth and what's lagging behind.
Example: Comparing Two Stocks
| Metric | Stock A | Stock B |
|---|---|---|
| Starting Price (5 years ago) | $50 | $100 |
| Ending Price (Today) | $85 | $150 |
| Number of Years | 5 | 5 |
| CAGR | 11.18% | 8.45% |
Despite Stock B having a higher price and a larger absolute gain ($50 vs $35), Stock A had a significantly better annualized growth rate. This is the kind of insight CAGR provides.
Analyzing Business Performance
A CEO or business analyst will often use CAGR to track key performance indicators (KPIs) over a multi-year business cycle.
- Revenue Growth: Has the company's revenue grown from $5 million to $12 million over 4 years?
- User Base Growth: Did a SaaS company's user base grow from 50,000 to 500,000 over 6 years?
- Profit Growth: How has the net profit evolved over the last business cycle?
Calculating the CAGR for these metrics helps stakeholders understand the company's true growth trajectory, stripped of seasonal or one-off fluctuations.
The Limitations of CAGR: What It Doesn't Tell You
While CAGR is powerful, it's not a perfect metric. It's crucial to understand its limitations to avoid making flawed interpretations.
1. It Ignores Volatility
CAGR's greatest strength is also its greatest weakness. By smoothing out returns, it completely hides the risk and volatility associated with an investment. Two investments could have the same CAGR of 10%, but one might have grown steadily year-over-year, while the other experienced wild swings, including major losses. An investor's journey with the second investment would have been far more stressful.
2. It Only Uses the Beginning and End Points
CAGR is a "point-to-point" calculation. It doesn't care what happened in the years between the start and end dates. This makes it highly sensitive to the chosen time period. A stock that crashed and then recovered might show a decent CAGR, masking the period of significant paper losses.
3. It Assumes No Cash Flows
The basic CAGR formula assumes a single lump-sum investment with no additions or withdrawals during the period. If you are regularly contributing to or withdrawing from your investment (like a 401(k) or a retirement fund), CAGR won't provide an accurate measure of performance. In those cases, other metrics like Internal Rate of Return (IRR) are more appropriate.
Managing Financial Data for CAGR Analysis
To perform accurate CAGR calculations, especially for multiple assets or business metrics, you need organized data. This often involves downloading annual reports, historical stock price data, or internal company spreadsheets. This data can quickly become cumbersome.
For instance, if you're analyzing a dozen companies, you might download 5-10 years of financial reports for each. To keep this data manageable for sharing with a colleague or archiving for later use, it's a good practice to bundle it. You can easily Compress Files into a single, smaller ZIP archive. This not only saves disk space but also keeps related documents neatly packaged together.
Conversely, you might receive financial data from an advisor or a data provider in an archived format like .7z or .tar.gz. Before you can extract the beginning and ending values for your calculation, you'll need a reliable way to Decompress Files and access the raw spreadsheets or PDFs within. Using a simple online tool streamlines this process, letting you get to your analysis faster.
CAGR vs. Average Annual Return (AAR)
It's easy to confuse CAGR with Average Annual Return (AAR), but they are fundamentally different, and the distinction is critical. AAR is the simple arithmetic mean of a series of annual returns, while CAGR is the geometric mean.
Let's illustrate with an example:
An investment of $1,000 has the following performance over 3 years:
- Year 1: Grows by 30% to $1,300.
- Year 2: Loses 20% to $1,040 (0.8 * $1,300).
- Year 3: Grows by 25% to $1,300 (1.25 * $1,040).
Calculating AAR:
- (30% + (-20%) + 25%) / 3 = 35% / 3 = 11.67%
The AAR suggests an average annual return of 11.67%. But does this reflect reality?
Calculating CAGR:
- Beginning Value = $1,000
- Ending Value = $1,300
- Years = 3
- CAGR = (($1,300 / $1,000)^(1/3)) - 1 = (1.3^0.333) - 1 = 1.0914 - 1 = 9.14%
The CAGR of 9.14% is a much more accurate representation of the investment's true annualized growth over the period. The AAR is artificially inflated because it doesn't account for the compounding effect and the impact of negative years on the investment's base value.
Conclusion: Your Go-To Metric for Growth Analysis
The Compound Annual Growth Rate is an indispensable tool for anyone serious about understanding investment performance or business growth. It provides a clean, standardized, and insightful measure that cuts through short-term noise and reveals the underlying long-term trend.
By understanding how to calculate it and, more importantly, how to interpret it within the context of its limitations, you can make more informed comparisons, set realistic goals, and build a clearer picture of your financial journey.
Ready to put your knowledge to the test? Stop doing the math by hand and start using a CAGR calculator for quick and accurate results. And for all your data management needs—from bundling financial reports to accessing archived data—remember to check out the suite of free, privacy-focused tools right here at Practical Web Tools.