Calculate Average Return Like a Pro: A Comprehensive Guide

Your Guide to Understanding and Calculating Average Investment Return
Are your investments truly performing as well as you think? It's a fundamental question every investor, from the novice to the seasoned pro, should be able to answer with confidence. You might see positive numbers in your portfolio, but understanding your average return over time is the key to evaluating strategy, planning for the future, and making smarter financial decisions. Simply looking at the final balance isn't enough; you need a precise metric to cut through the noise of market volatility.
This comprehensive guide will demystify the concept of average return. We'll explore the crucial differences between the two primary methods of calculation—the Arithmetic Mean and the Geometric Mean—and show you why choosing the right one is critical. We'll walk you through how to calculate it yourself, how to use an online calculator for instant results, and, just as importantly, how to manage the financial data that fuels these calculations. By the end, you'll have the knowledge to measure your investment performance like a professional.
What Exactly Is Average Return?
At its core, the average return is a measure used to represent the typical return of an investment over a specific period. It's a single percentage that summarizes the overall performance of a stock, mutual fund, or entire portfolio, smoothing out the inevitable peaks and valleys of market fluctuations. However, not all "averages" are created equal. In finance, there are two important types you must know.
Arithmetic Mean Return
The arithmetic mean is the simplest form of average. You calculate it by summing up the returns for each period and then dividing by the number of periods. It’s the same way you’d average a set of test scores.
Formula: Arithmetic Mean = (R1 + R2 + ... + Rn) / n
Where:
Ris the return for each period (e.g., R1 is the return for year 1).nis the total number of periods.
While easy to calculate, the arithmetic mean can be misleading for investments over multiple periods because it doesn't account for the effects of compounding.
Geometric Mean Return
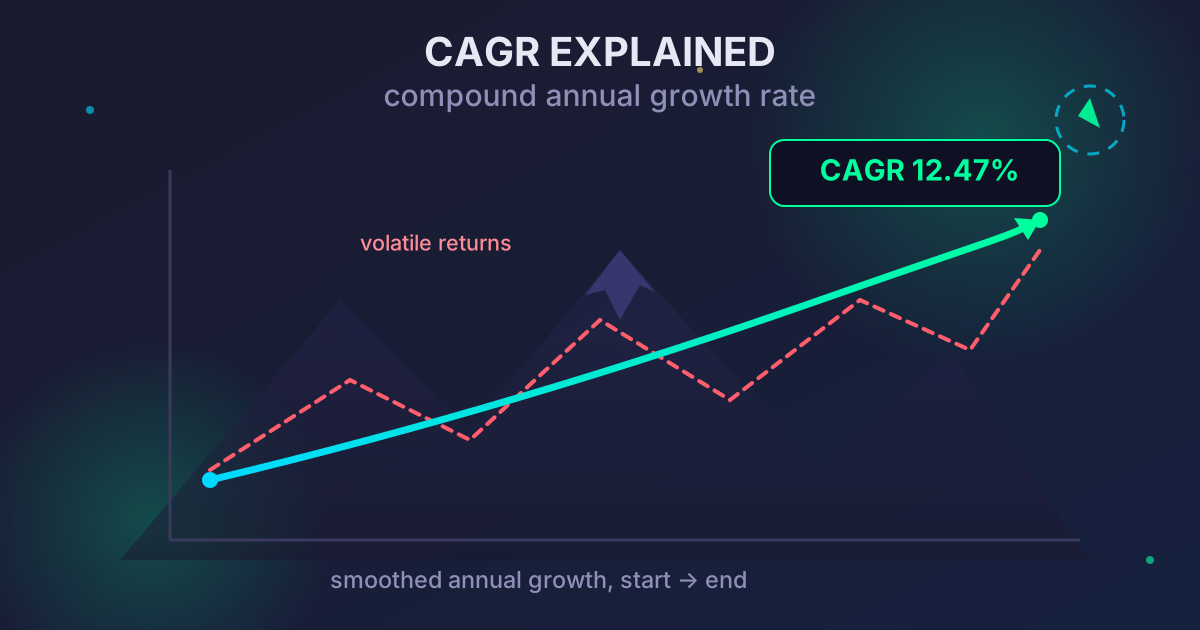
The geometric mean return provides a more accurate picture of an investment's true performance over time because it incorporates the effects of compounding. It calculates the average rate of return per period, assuming that returns are reinvested.
Formula: Geometric Mean = [(1 + R1) * (1 + R2) * ... * (1 + Rn)]^(1/n) - 1
This formula looks more complex, but it essentially tells you the constant annual return you would have needed to achieve the same final result. It is the gold standard for measuring multi-period investment performance.
Why Calculating Average Return is Crucial
Calculating your average return isn't just an academic exercise; it's a vital practice for effective portfolio management.
-
Objective Performance Evaluation: It provides a standardized metric to assess how well your investments are doing. Are you meeting your financial goals? Is your portfolio outperforming, or underperforming, key benchmarks like the S&P 500?
-
Informed Future Planning: While past performance is not a guarantee of future results, historical average returns are a primary tool for financial forecasting. They help you project your portfolio's potential growth and plan for retirement, education, or other major life goals.
-
Effective Investment Comparison: Average return allows you to make apples-to-apples comparisons between different assets. You can objectively evaluate whether a high-growth tech stock was a better investment over the last five years than a stable dividend-paying utility stock.
How to Use an Average Return Calculator
While you can calculate returns manually (as we'll show you below), a dedicated online calculator is the fastest and most accurate method. Here’s a step-by-step guide to using one effectively.
-
Gather Your Investment Data: Before you begin, collect all the necessary information. This typically includes:
- The initial investment amount.
- The final value of the investment.
- The returns for each individual period (e.g., annual returns as percentages).
- The total number of periods (e.g., years, months).
-
Choose the Calculation Method: A good calculator will allow you to choose between the arithmetic and geometric mean. As we'll discuss further, for evaluating past performance over multiple years, the geometric mean is almost always the superior choice.
-
Input Your Values: Carefully enter your data into the corresponding fields in the calculator. For period returns, ensure you are using the correct format (e.g., enter
10for a 10% gain and-5for a 5% loss). -
Calculate and Interpret the Result: The tool will instantly provide the average return as a percentage. This figure represents the smoothed-out, average gain or loss your investment experienced per period.
Manual Calculation: The Power of a Real-World Example
To truly grasp the difference between the two methods, let's walk through a scenario. Imagine you invest $1,000 in a stock for three years.
- Year 1: The stock has a great year, gaining 25%. Your investment grows to $1,250.
- Year 2: The market takes a downturn, and the stock loses 20%. Your investment falls to $1,000. (Note: a 20% loss from $1,250 is $250).
- Year 3: The stock recovers, gaining 10%. Your investment ends at $1,100.
Calculating the Arithmetic Mean
Using the formula, we add the returns and divide by 3:
(25% - 20% + 10%) / 3 = 15% / 3 = 5%
The arithmetic mean return is 5%. But if we apply a 5% gain for three years to the initial $1,000, we get $1,157.63—which is not our actual ending value of $1,100. This shows how the arithmetic mean can be misleading.
Calculating the Geometric Mean
Now let's use the geometric mean formula, converting percentages to decimals:
[(1 + 0.25) * (1 - 0.20) * (1 + 0.10)]^(1/3) - 1
= [1.25 * 0.80 * 1.10]^(1/3) - 1
= [1.10]^(1/3) - 1
= 1.03228 - 1
= 0.03228 or 3.23%
The geometric mean return is 3.23%. If we apply this compounded return for three years to the initial $1,000, we get $1,100. It perfectly matches our ending value, proving its accuracy in reflecting true performance.
Arithmetic vs. Geometric Mean: Which to Use?
This table summarizes the key differences and best use cases for each method.
| Feature | Arithmetic Mean Return | Geometric Mean Return |
|---|---|---|
| Calculation | Simple average of periodic returns | Compounded average of periodic returns |
| Best For | Forecasting a single future period based on history | Accurately representing past performance over multiple periods |
| Effect of Volatility | Tends to overstate long-term performance | Provides a more realistic figure that accounts for volatility |
| Key Question | "What is the expected return for next year?" | "What was my actual annualized return over the last 5 years?" |
Managing Your Financial Data for Accurate Calculations
An average return calculator is only as good as the data you feed it. Maintaining accurate, organized financial records is a non-negotiable part of serious investing. This often involves tracking performance in spreadsheets or downloading monthly and annual reports from your brokerage.
Over time, this data can accumulate into a significant digital archive. Managing these files efficiently is crucial for both analysis and record-keeping.
For instance, as you track your investments over several years, your financial spreadsheets and downloaded PDF reports can become quite large. Emailing a 50MB Excel file with a decade of stock data to your financial advisor can be a hassle. A simple solution is to use an online tool to Compress Files. This can shrink your documents into a much smaller ZIP or 7Z archive, making them easy to send and store.
Archiving is another key aspect of good data management. At the end of each fiscal year, you'll want to save a snapshot of your portfolio's performance. Compressing these annual records saves significant disk space. If you receive financial documents from an institution in a less common format like 7Z, you might need to convert it for compatibility. Our free 7Z to ZIP tool handles this in seconds, ensuring you can access your files on any device.
Collaboration often introduces file format challenges. Imagine you've zipped up your entire investment history on a Windows PC, but your collaborator uses a Linux-based system and prefers TAR archives. Instead of re-archiving everything from scratch, you can simply use a converter like our ZIP to TAR tool to bridge the compatibility gap seamlessly.
Common Pitfalls to Avoid When Analyzing Returns
When calculating your average return, be mindful of these common mistakes that can skew your perception of performance.
- Ignoring Costs: Your true return is what's left after all costs. Always factor in brokerage fees, trading commissions, and fund expense ratios, as they directly reduce your gains.
- Forgetting About Taxes: Unless your investments are in a tax-advantaged account like a 401(k) or IRA, capital gains taxes will take a bite out of your profits. Your pre-tax return is not your take-home return.
- The Inflation Illusion: A 6% return might feel good, but if inflation is at 4%, your real return (your increase in purchasing power) is only 2%. Always consider the impact of inflation on your results.
- Using Inaccurate Data: The principle of "garbage in, garbage out" applies perfectly here. Double-check your numbers for accuracy, including the correct handling of dividends and stock splits.
Conclusion: Take Control of Your Investment Analysis
Understanding and accurately calculating your average return is a cornerstone of smart investing. It transforms you from a passive observer into an active, informed manager of your own financial future. Remember that the geometric mean is your most reliable tool for evaluating historical performance, as it provides a true picture of your portfolio's compounded growth.
Equally important is the diligent management of your financial data. Keeping your records organized, secure, and accessible is fundamental to performing these crucial calculations. By combining powerful analysis with smart data practices, you can gain a clear and accurate view of where you've been and where you're headed.
Empower your financial journey by understanding your true investment performance. Use an average return calculator to get the numbers, and leverage a suite of powerful file management tools to keep your data in order. Explore the free, secure, and privacy-focused utilities at Practical Web Tools to help you succeed.