Variance Calculator: The Ultimate Statistics Guide for Beginners

Your Comprehensive Guide to Understanding and Calculating Variance
Have you ever looked at a set of numbers and felt like the average just wasn't telling the whole story? Imagine two investment portfolios both have an average annual return of 8%. One has returns of 7%, 8%, and 9% over three years. The other has returns of -10%, 8%, and 26%. While the average is the same, the second portfolio is dramatically more volatile and risky. The key difference lies in their variance.
Understanding variance is like gaining a superpower in data analysis. It allows you to see beyond the average and grasp the true nature of a dataset—its consistency, its volatility, and its spread. Whether you're a student tackling a statistics project, a financial analyst assessing risk, or a researcher validating an experiment, variance is a fundamental concept you need to master.
This comprehensive guide will demystify variance for you. We'll break down what it is, why it's so critical, the difference between population and sample variance, and provide step-by-step instructions on how to calculate it. We'll also show you how a variance calculator can be your best friend for handling complex datasets, making statistical analysis more accessible than ever.
What Exactly is Variance in Statistics?
In simple terms, variance is a measure of dispersion. It quantifies how much the data points in a set vary from their mean (average). A small variance indicates that the data points tend to be very close to the mean and to each other. A large variance indicates that the data points are spread out over a much wider range of values.
Think of it like an archery competition. An archer with low variance will have their arrows clustered tightly around the bullseye. Even if they aren't perfectly centered, they are consistent. An archer with high variance will have their arrows scattered all over the target. Their shots are inconsistent and unpredictable.
The formal definition of variance is the average of the squared differences from the Mean. This might sound complicated, but the squaring part is crucial. It ensures that all differences are positive (so they don't cancel each other out) and it gives more weight to data points that are far from the mean (outliers). This makes variance a very sensitive measure of spread.
Why is Variance So Important in Data Analysis?
Variance isn't just an abstract mathematical concept; it has powerful real-world applications across numerous fields. Understanding it helps in making more informed decisions based on data.
Here are some key reasons why variance is so important:
- Assessing Consistency and Quality Control: In manufacturing, variance is used to monitor the consistency of a product. For example, a factory producing 500ml water bottles needs to ensure each bottle contains very close to 500ml. Low variance means the process is stable and reliable; high variance signals a problem that needs correction.
- Financial Risk Management: In finance and investing, variance is a primary measure of risk. An investment with high variance in its returns is considered volatile and risky. Investors use it to build portfolios that match their risk tolerance.
- Scientific Research: Researchers use variance to test hypotheses. In a clinical trial for a new drug, they might compare the variance in patient recovery times between a control group and a test group. A significant difference can indicate the drug's effectiveness.
- Machine Learning and AI: In machine learning, variance is used in feature selection. A feature with zero or very low variance provides little to no information for a predictive model and can often be removed.
- Comparing Datasets: Variance allows for a quantitative comparison of the spread between two or more datasets. You can objectively determine which group is more homogeneous (low variance) or heterogeneous (high variance).
Core Concepts: Building Blocks for Calculating Variance
Before diving into the formulas, let's quickly review a few essential terms that are the building blocks of variance.
Mean (Average)
The mean is the sum of all values in a dataset divided by the number of values. It's the central point around which variance is calculated.
- Population Mean (μ): The mean of the entire group of interest.
- Sample Mean (x̄): The mean of a smaller, representative group (a sample) taken from the population.
Deviation
Deviation is simply the distance of a single data point from the mean. It's calculated as (data point - mean). A positive deviation means the point is above the mean, and a negative deviation means it's below.
Squared Deviation
This is the deviation of a data point, squared. We square the deviations for two key reasons:
- To eliminate negative numbers: If we just added up the deviations, the positive and negative ones would cancel each other out, giving a misleading result of zero.
- To amplify outliers: Squaring gives greater weight to data points that are further from the mean. This makes variance a sensitive indicator of extreme values.
The Two Types of Variance: Population vs. Sample
One of the most common points of confusion when learning about variance is the distinction between population variance and sample variance. The one you use depends entirely on the data you have.
Population Variance (σ²)
You calculate population variance when your dataset includes every single member of the group you are interested in. For example, if you want to know the variance of the heights of all students in a specific classroom, and you have the height of every student, you are dealing with a population.
The formula for population variance is: σ² = Σ (xᵢ - μ)² / N
Where:
- σ² is the population variance symbol.
- Σ is the summation symbol (meaning "sum of").
- xᵢ is each individual data point.
- μ is the population mean.
- N is the total number of data points in the population.
Sample Variance (s²)
More often than not, it's impractical or impossible to collect data from an entire population. Instead, we collect data from a smaller subset, called a sample. We then use this sample to make an inference or estimation about the whole population.
The formula for sample variance is slightly different: s² = Σ (xᵢ - x̄)² / (n - 1)
Where:
- s² is the sample variance symbol.
- xᵢ is each individual data point in the sample.
- x̄ is the sample mean.
- n is the number of data points in the sample.
Notice the denominator is n - 1, not n. This is known as Bessel's Correction. Using n - 1 provides a more accurate and unbiased estimate of the true population variance when working with a sample. It slightly increases the calculated variance to account for the fact that a sample is less likely to capture the extreme values present in the full population.
Quick Comparison Table
| Feature | Population Variance (σ²) | Sample Variance (s²) |
|---|---|---|
| Data Used | The entire group of interest (population) | A subset of the population (sample) |
| Purpose | To describe the exact variance of the group | To estimate the variance of the population |
| Denominator | N (total number of items) | n - 1 (sample size minus one) |
| Symbol | σ² (sigma squared) | s² (s squared) |
How to Calculate Variance: A Step-by-Step Guide
Let's walk through the manual calculation process with a couple of clear examples. This will help you understand exactly what a variance calculator does behind the scenes.
Example 1: Calculating Population Variance (σ²)
Imagine a small company has 5 employees. We want to find the variance of their ages. Since we have data for every employee, this is a population.
The ages are: 32, 45, 28, 51, 34
Step 1: Calculate the Mean (μ) μ = (32 + 45 + 28 + 51 + 34) / 5 = 190 / 5 = 38
Step 2: Calculate the Squared Deviations from the Mean For each age, subtract the mean (38) and square the result.
- (32 - 38)² = (-6)² = 36
- (45 - 38)² = (7)² = 49
- (28 - 38)² = (-10)² = 100
- (51 - 38)² = (13)² = 169
- (34 - 38)² = (-4)² = 16
Step 3: Sum the Squared Deviations Σ (xᵢ - μ)² = 36 + 49 + 100 + 169 + 16 = 370
Step 4: Divide by the Total Number of Data Points (N) σ² = 370 / 5 = 74
The population variance of the employees' ages is 74.
Example 2: Calculating Sample Variance (s²)
Now, let's say a researcher wants to estimate the variance of the daily screen time for all teenagers in a city. It's impossible to survey everyone, so they take a sample of 10 teenagers.
The daily screen times (in hours) are: 5, 7, 4, 8, 6, 9, 5, 7, 10, 8
Step 1: Calculate the Sample Mean (x̄) x̄ = (5+7+4+8+6+9+5+7+10+8) / 10 = 69 / 10 = 6.9
Step 2: Calculate the Squared Deviations from the Sample Mean
- (5 - 6.9)² = (-1.9)² = 3.61
- (7 - 6.9)² = (0.1)² = 0.01
- (4 - 6.9)² = (-2.9)² = 8.41
- (8 - 6.9)² = (1.1)² = 1.21
- (6 - 6.9)² = (-0.9)² = 0.81
- (9 - 6.9)² = (2.1)² = 4.41
- (5 - 6.9)² = (-1.9)² = 3.61
- (7 - 6.9)² = (0.1)² = 0.01
- (10 - 6.9)² = (3.1)² = 9.61
- (8 - 6.9)² = (1.1)² = 1.21
Step 3: Sum the Squared Deviations Σ (xᵢ - x̄)² = 3.61 + 0.01 + 8.41 + 1.21 + 0.81 + 4.41 + 3.61 + 0.01 + 9.61 + 1.21 = 32.9
Step 4: Divide by the Sample Size Minus One (n - 1) n = 10, so n - 1 = 9 s² = 32.9 / 9 = 3.656
The sample variance of the teenagers' screen time is approximately 3.656.
The Next Step: From Variance to Standard Deviation
While variance is incredibly useful, its units are squared (e.g., 'squared years' or 'squared hours'). This can be difficult to interpret in a real-world context.
This is where Standard Deviation comes in. The standard deviation is simply the square root of the variance. It translates the measure of spread back into the original units of the data, making it much more intuitive.
- Population Standard Deviation (σ): √σ²
- Sample Standard Deviation (s): √s²
Using our examples:
- The standard deviation of employee ages is √74 ≈ 8.6 years.
- The standard deviation of teenage screen time is √3.656 ≈ 1.91 hours.
This tells us that, on average, an employee's age is about 8.6 years away from the mean age of 38. This is much easier to understand than a variance of 74.
Using a Variance Calculator: The Practical Approach
As you can see, manual calculations become tedious and prone to error very quickly, especially with larger datasets. This is where using an online variance calculator is the smart, practical choice.
Before you can use a calculator, however, you need to manage your data. Large datasets for statistical analysis are often shared in compressed formats like .zip or .7z to save storage space and make them easier to transfer. If you've received data in this format, your first step is to extract it. You can easily use a tool to Decompress Files and access the raw data within.
Once you have your data prepared, using a variance calculator is simple:
- Input your data: Copy and paste your comma-separated or space-separated numbers into the calculator.
- Select the type: Choose whether you are calculating for a population or a sample. This is the most important step!
- Calculate: Click the button, and the tool will instantly provide the variance, standard deviation, mean, and other useful statistics.
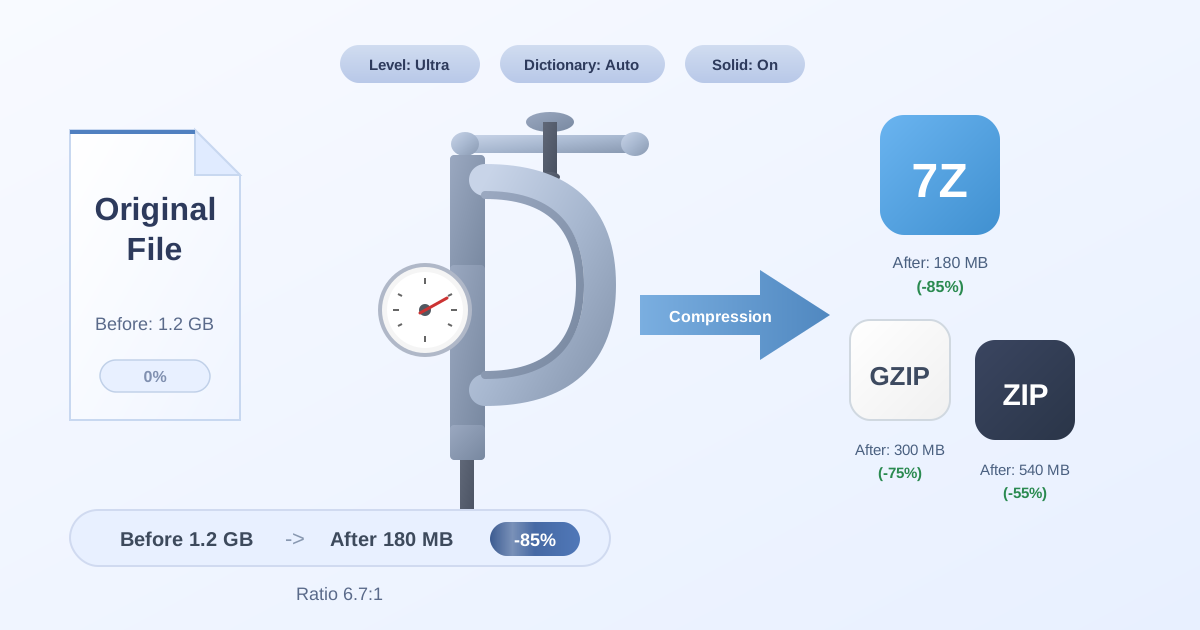
After you've completed your analysis, it's good practice to organize your dataset, results, and notes into a single folder. To archive this work or share it efficiently with a colleague, you can Compress Files into a single, compact ZIP archive. Occasionally, you may encounter different archive formats. If a collaborator needs a .zip file but you have a .7z, a simple 7Z to ZIP converter can solve the problem in seconds.
Conclusion: Mastering Data Spread with Variance
Variance is more than just a number; it's a powerful lens through which to view your data. It reveals the consistency, stability, and diversity hidden within a set of numbers, providing critical context that the average alone cannot. By understanding the core concepts, the crucial difference between population and sample calculations, and the intuitive relationship with standard deviation, you are well-equipped to perform more sophisticated and accurate data analysis.
While knowing how to calculate variance manually is essential for understanding the concept, remember that tools are there to make your life easier. A reliable variance calculator, combined with practical data management skills, will save you time and prevent errors, allowing you to focus on what truly matters: interpreting the results and drawing meaningful conclusions.
Ready to tackle your next data challenge? Explore the full suite of free, secure, and practical web tools at PracticalWebTools.com to help you manage, convert, and analyze your data with ease.